
In the last several blogs I have been writing about the light you can expect to receive from each window direction (north, south, east, and west). Many things affect the amount of light your window gets, not just window direction. I recently purchased a smart plant monitor to help me assess the light situation around my house. This device monitors soil moisture, soil fertility, temperature, and light. I will only be focusing on light in this blog, as my main goal in purchasing this was as a light meter for plants.

Most meters I have seen give you point-in-time reading. In other words, you have to actively be looking at the meter to get the measurement. So if I want to get an accurate read on how much light a plant receives all day, then I need to check one of those meters manually every hour of daylight. That’s too much work. I’m 21st Century lazy. I was on the market for an electronic light meter and found this smart plant monitor. You stick it in your plant pot, set up the app, connect the meter to your app, and it tracks light all day. That’s exactly what I was looking for. Check out the details on using this device as a light meter for plants below.
Startup
Out of the box, the meter is ready in minutes. You have to pull the plastic tab out that is blocking the battery from completing the circuit. Install the VegTrug app, which is free. The app is available for both apple and android devices. Register your email with the app. Then pair the app with your meter using Bluetooth. I want to note two things here that I appreciate already. Aside from a confirmation email when registering, this app has not emailed me anything. In addition, the app has not given me any notifications either. I hate when a new app starts giving me a billion notifications that I have to go back and disable.
Set Up the Light Meter for Plants
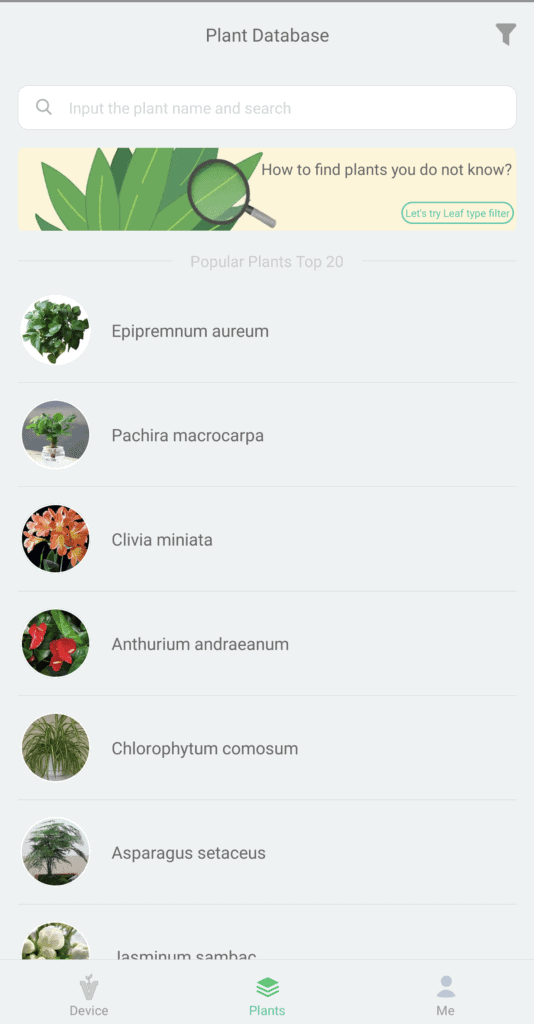
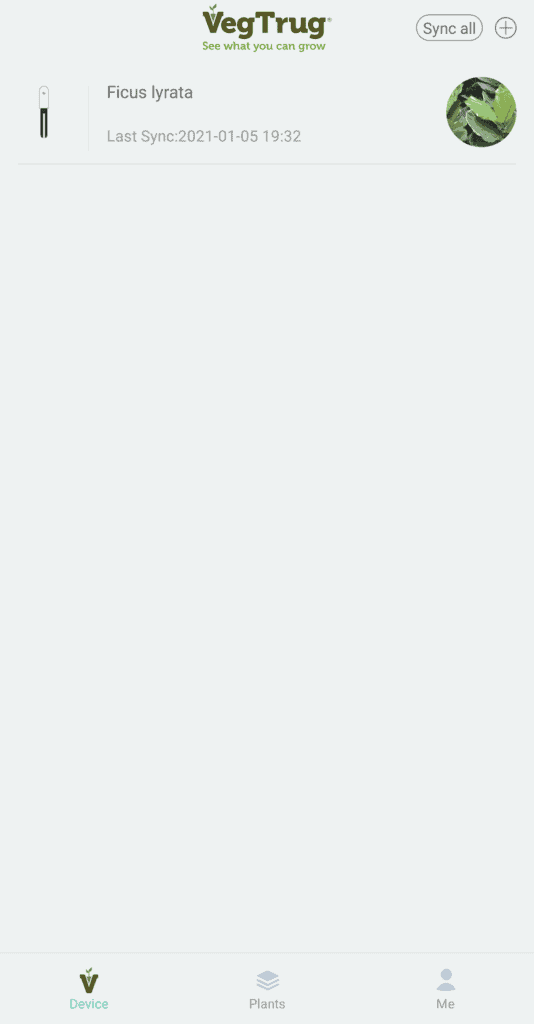
In order to start tracking, you must first select a plant from the app’s Plant Database. The database has over 6000 plants. You should be able to find most houseplants. Some weird examples are that the database does not have my Euphorbia Trigona, which I think is a somewhat popular houseplant, but it does have my Limequat Tree (a lime kumquat hybrid that isn’t even a full-time houseplant). Anyway, you have to pick a plant in order for the meter and app to work together. Just pick something close if you can’t find what you’re looking for. Once you have selected your plant, you stick the meter in the soil. Make sure the device is not obstructed from light. For example, don’t put it behind leaves or behind the pot rim. Now that you’re set up you can sync the device data with the app at any time. There is a Sync All button on the home screen which does the trick. It takes longer to sync the longer you wait between syncing, which makes sense, more data takes more time.
Monitoring Multiple Plants
One device can track multiple plants. Not at the same time of course, it has to be inserted into the soil, but you can switch plants in the app. You could realistically use one device for several plants. To switch plants you have to be on the main dashboard of the currently registered plant. Then you need to click the three dots menu icon in the top right corner. Then select Switch Plant from the menu. The great news is the app stores information for plants that you previously registered so switching between plants is easy. You can also add a new plant following the description earlier about picking a plant.
Plant Information
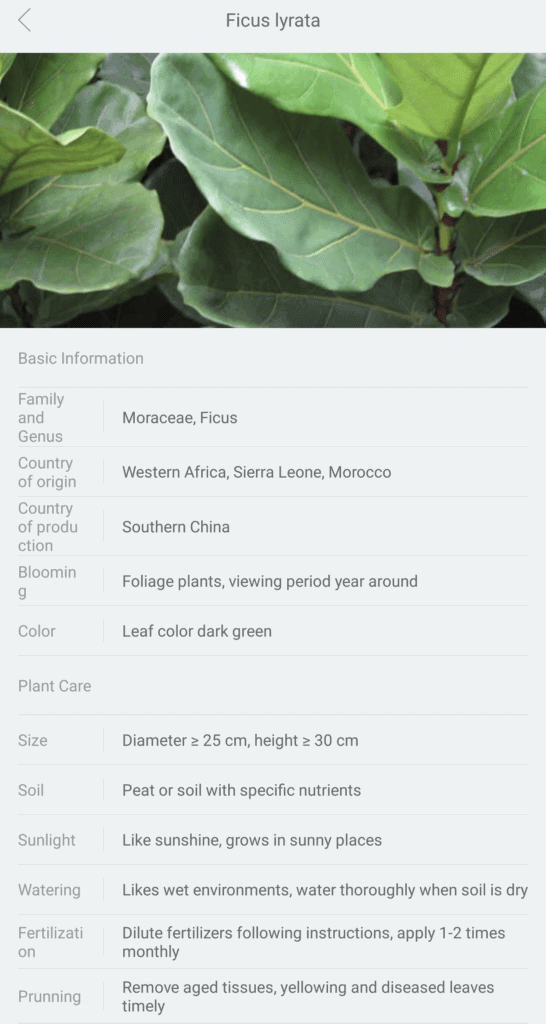
The Plant Database holds a lot of information for a lot of plants. Once you have registered a plant in the app you can view some quick facts about it. From the plant’s main dashboard click the three dot menu in the top left corner, and then click Plant Settings. The app shows some basic facts about the plants and recommended care instructions. See an example below.
What Does the Light Meter Tell You?
If you click on your plant from the home screen, it will take you to a dashboard with the current information about your plant. It tells you how many days you have been monitoring the plant. The soil moisture, soil fertility, sunlight, and temperature are displayed. Each category displays an acceptable range of measurement that is customized for each plant in the database. You’ll see in the example below that my Fiddle Leaf Fig was receiving 7355 lux at the time I took this screenshot, which is within the acceptable range. Soil and Fertility are blank because I didn’t even bother sticking the meter in the soil. I’m only interested in a light meter for plants right now.
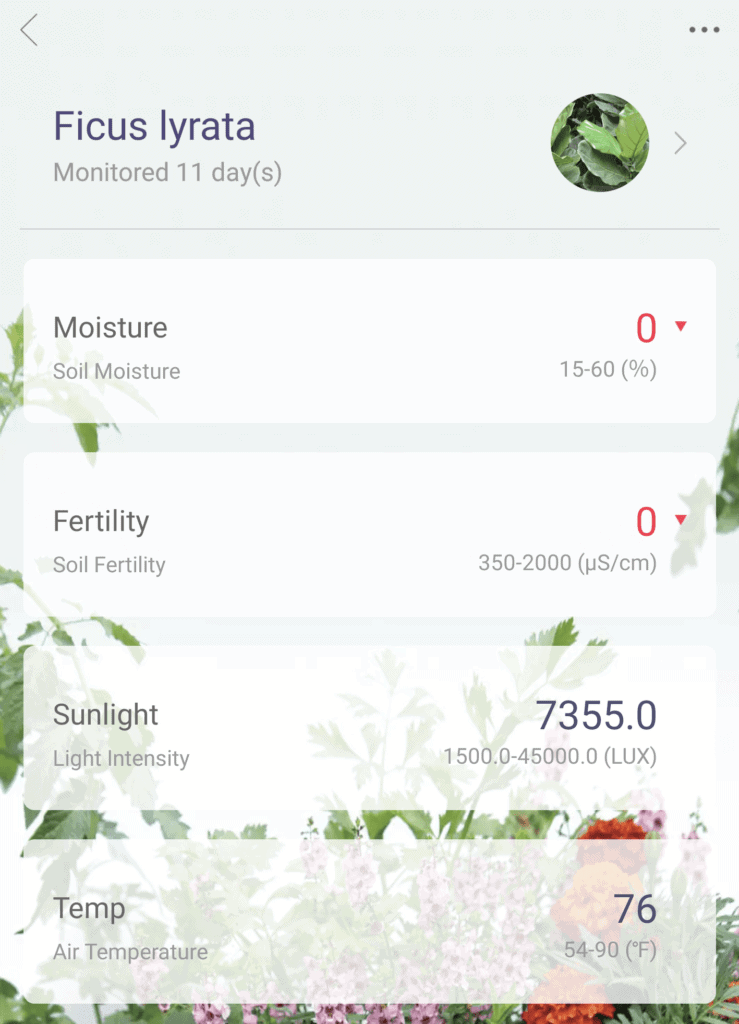
I like that this app gives you personalized ranges for each plant and metric. I don’t know much about lux, the light intensity measurement, so it’s nice to be able to tell if you’re in the good range without looking anything else up.
Reports
As I explained above, reports are the primary reason I got this device. I’m interested in the report. From the plant dashboard, you must click the three dots menu, and then select Reports. The report shows you a vertical bar chart for Light, Moisture, and Fertility. Again, I’m only focusing on the Light section in this blog. See the three screenshots below for more information.
Bar Charts
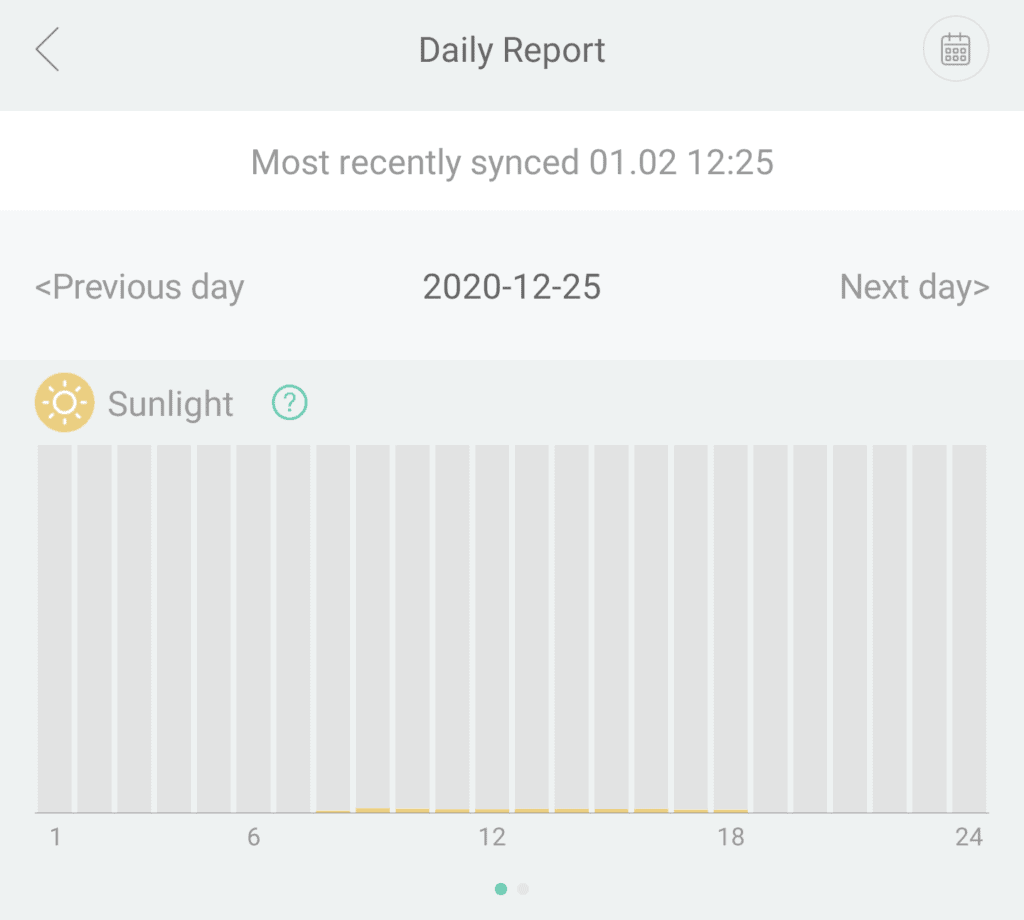
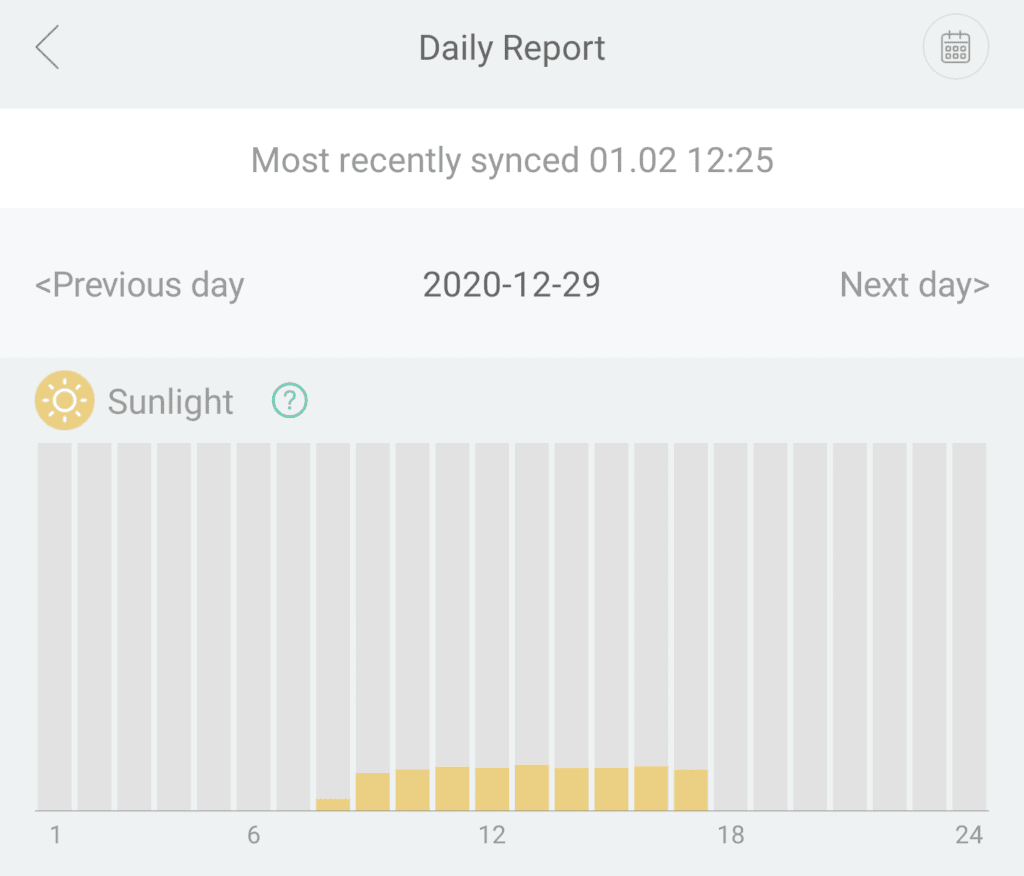
The vertical bar chart shows hourly readings for a single day. On the top left corner, you can navigate to a previous day’s report. I don’t know if there is a limit to the number of days you can go back. If so, I haven’t reached it after 13 days. One thing I’m not a fan of is that the scale of the vertical axis is fixed. I started the meter in a north-facing window in the middle of winter and I could barely see the bars measuring light. A dynamic vertical scale based on that day’s values would vastly improve the user experience. I like that you can click on a single bar in the chart, and it shows you the actual measurement value above. However, they switch from using lux on the dashboard to mmol in the report. I found that confusing.
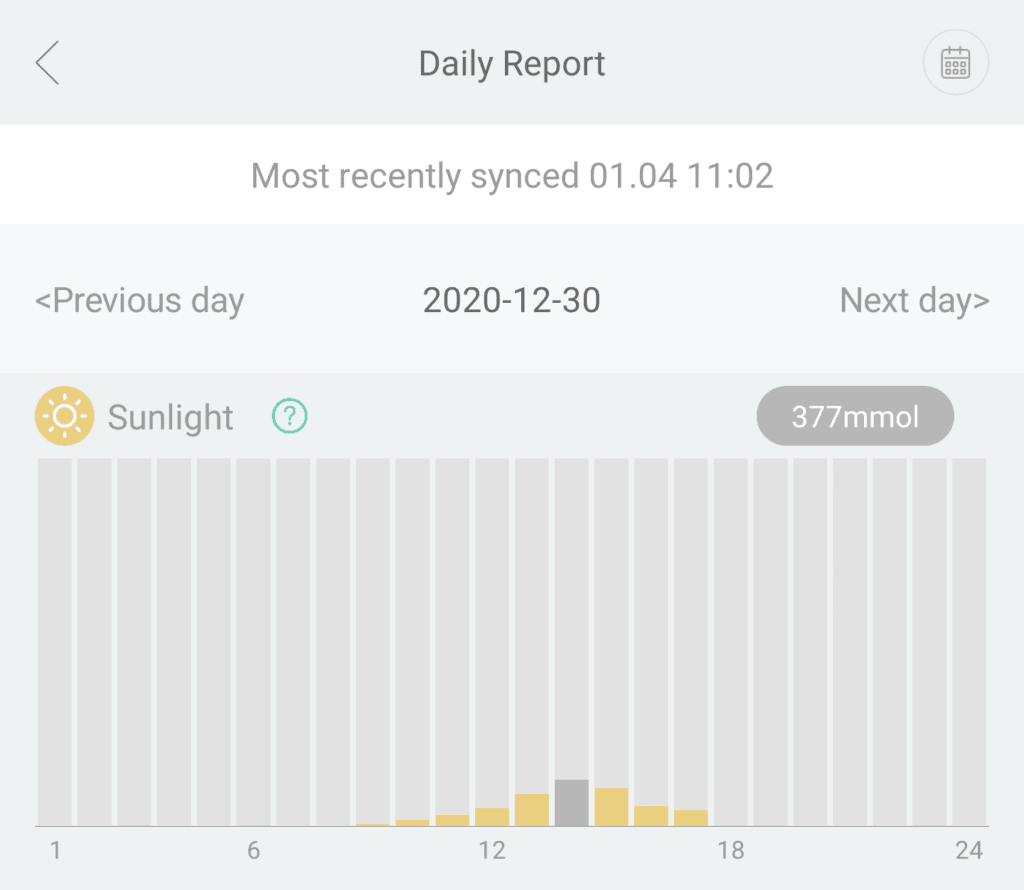
Light Metrics
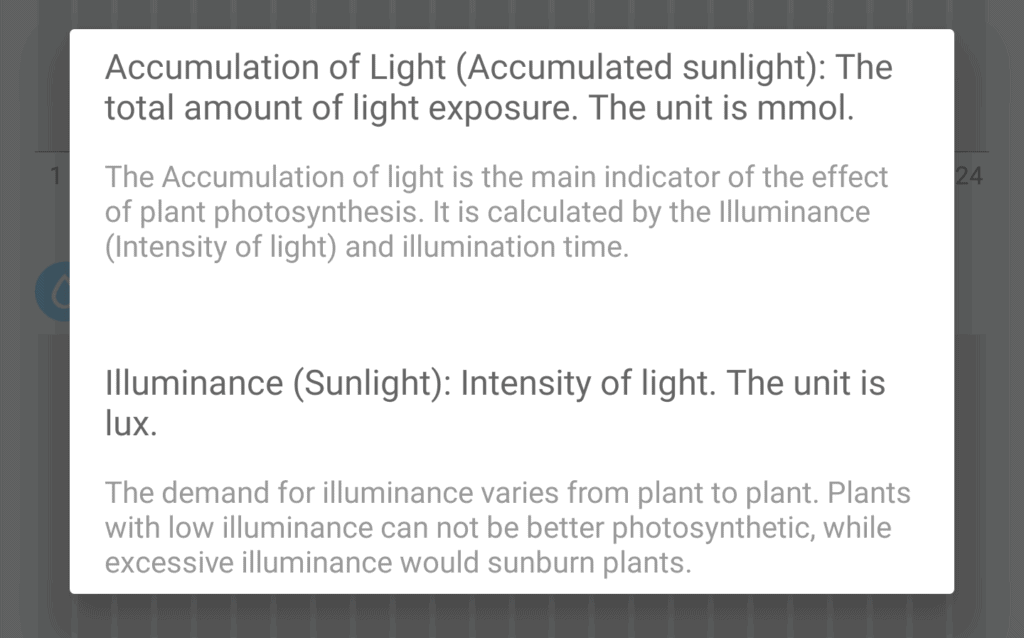
If you hit the question mark icon next to Sunlight, it will provide the explanation below. It seems that lux is a single snapshot of light intensity whereas mmol, micromoles, is a measure of the accumulation of light. It sounds like mmol is really what we’re after. GroWell does an excellent job of explaining this in more depth.
Plant-specific Ranges
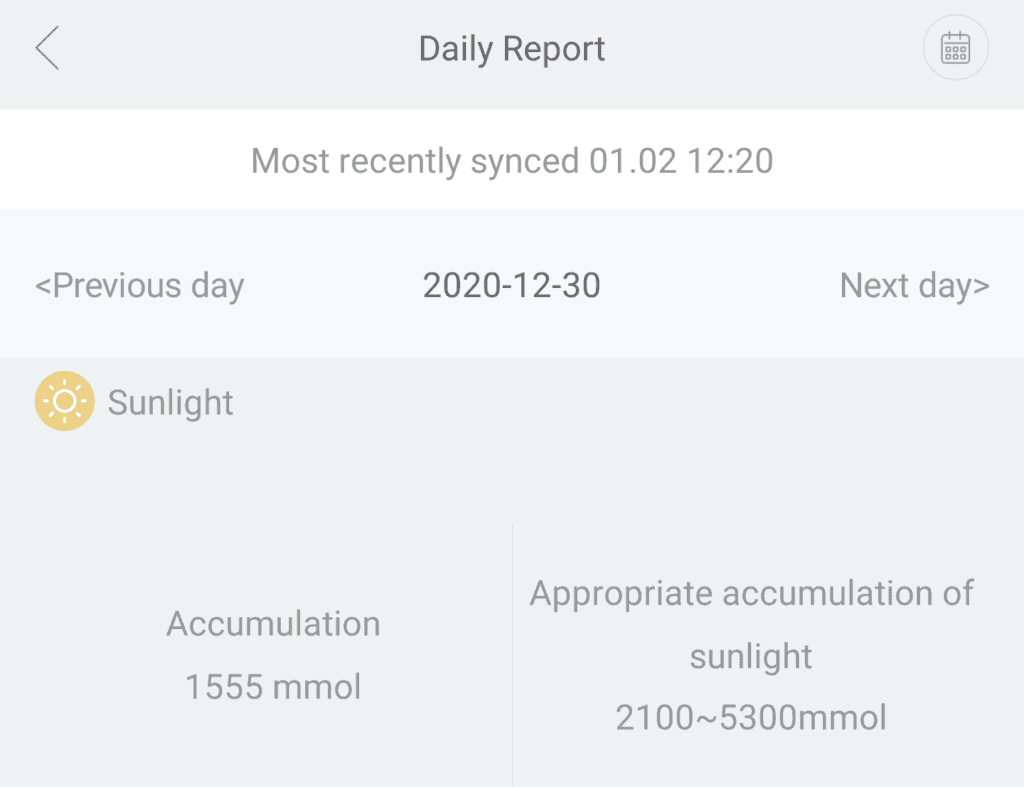
Back to the report, if you swipe left on the bar chart, you get more mmol information. On the left side, it tells you the amount of light in mmols that your plant accumulated that day. On the right side, it gives you an acceptable range of light accumulation for your particular plant. My Fiddle Leaf Fig is actually below the acceptable level right now. However, it’s the middle of winter. The shortest day of the year was less than two weeks ago. My plant is dormant and it’s fine that it is not receiving the amount of light it needs for growth.
How to Use a Light Meter for Plants
Compare the Light Accumulation of Different Areas
I purchased the smart plant monitor to evaluate the light in certain areas of my house. There are some plants I want to rearrange and I want to make sure they will be getting the light they need. I have also used it to evaluate new plant spots in my house. To test it out, I first place the meter in a north-facing window. I confirmed that the light readings from that window were not great, since north-facing windows receive no direct light. Next, I moved the meter to a south-facing window. South-facing windows get the most intense direct sunlight. You can see the reports in the comparison below.
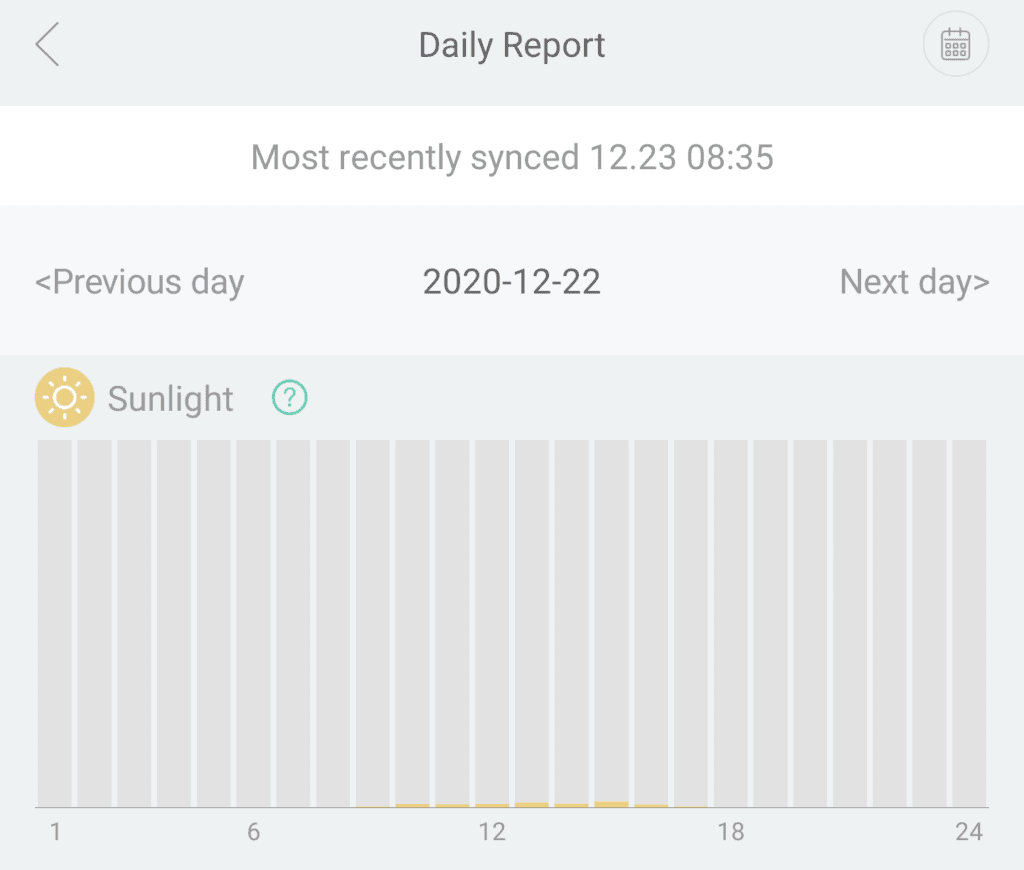
Now here is one way that the fixed vertical scale of the bar chart comes in handy because we can visually compare these charts. If the scale was adapted to that day’s reading as I suggested earlier, it would be easier to read but you couldn’t do this side-by-side comparison. However, I made this comparison outside of the app. I don’t believe it was intentionally developed with a fixed scale for comparison purposes.
Evaluate Grow Light Placement
If you have a grow light or are considering getting one, you need to know that placement matters. Distance matters much more for grow lights compared to sunlight. For example, if I stick the meter in the soil of my Limequat tree that is wintering inside with a grow light, the light meter reads pretty poorly. Compared side-by-side with the reading I did the next day when I stuck the light meter in one of the branches about a foot away from the grow light. There’s a big difference in the reading.
To be thorough, I did the same thing in my south-facing window that only receives sunlight, and there was no discernable difference in the light accumulation from soil (further from the sun) to branch(closer to the sun).
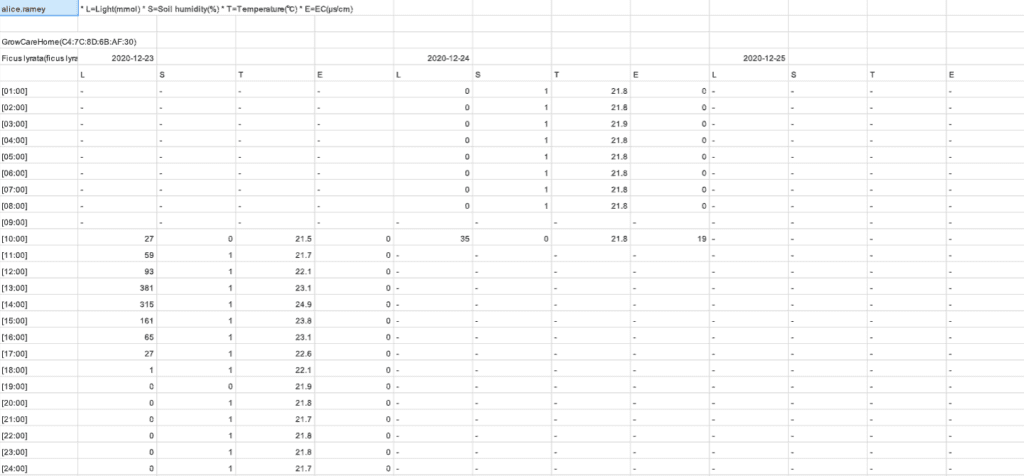
Export Report Data
The app allows you to extract the report data and it emails you a CSV with your device’s data. I tracked several plants over two weeks and was pleasantly surprised to find that it gives you data for all the plants you have tracked ever, not just the one that is currently registered. As I stated before you can only track one plant at a time, but all the data that you have tracked is there. There are just a lot of blanks for the days you were tracking another plant. I can’t speak to whether there are limits to the number of days you can extract at once. However, you can see the days are recorded horizontally which means you will end up with a lot of columns quickly. I’m a number cruncher for a living so I might write a program to process these reports on a monthly basis. I didn’t buy this device to do any long-term plant tracking, but it’s an added bonus.
Smart Plant Monitor as a Light Meter for Plants
I bought this device to make myself more informed on the light and optimal positioning of my plants. In that regard, it did exactly what I wanted it to do. I like that the app has so many plants and their light requirements available in the app. That removes the extra step of looking that information up, which exceeded my expectations. In addition, the ability to track and store information for multiple plants with only one device is a feature I didn’t even know I wanted. I haven’t even used all the features for moisture or fertility metrics, but already consider this product worth it.
Do you use a light meter? How do you determine the optimal plant placement? Share in the comments.
I'm a long time plant lover on the quest to happily coexist with as many plants as I can. Let's grow!